FREE SPREADSHEET TEMPLATE
The 13-week cash flow template that shows how many weeks of payroll your cash covers
This free 13-week cash flow template is the spreadsheet version of the 13-week cash view Ivanka Menken uses with founders. You enter thirteen weeks of receipts and payments by type; it works out wages, super and payroll tax, closing cash, weeks of payroll covered and a downside scenario, and shows the tightest week on a dashboard.
By Ivanka Menken, Strategic Mentor·Updated
WHAT IS INSIDE
What is in the spreadsheet?
Five sheets, no macros, every output a formula you can read. It opens in Excel, Google Sheets and Numbers.
- Cover: how to use it in five steps, a sheet map with links, a colour legend, the example figures to clear, and a status line that reads Ready only when every check passes.
- Inputs: the date week 1 starts, opening cash, your minimum cash, the scenario, payroll settings (gross wages per pay run, pay frequency, next pay day, PAYG withholding, super guarantee at 12%, your payroll tax rate) and thirteen weeks of receipts and payments by type.
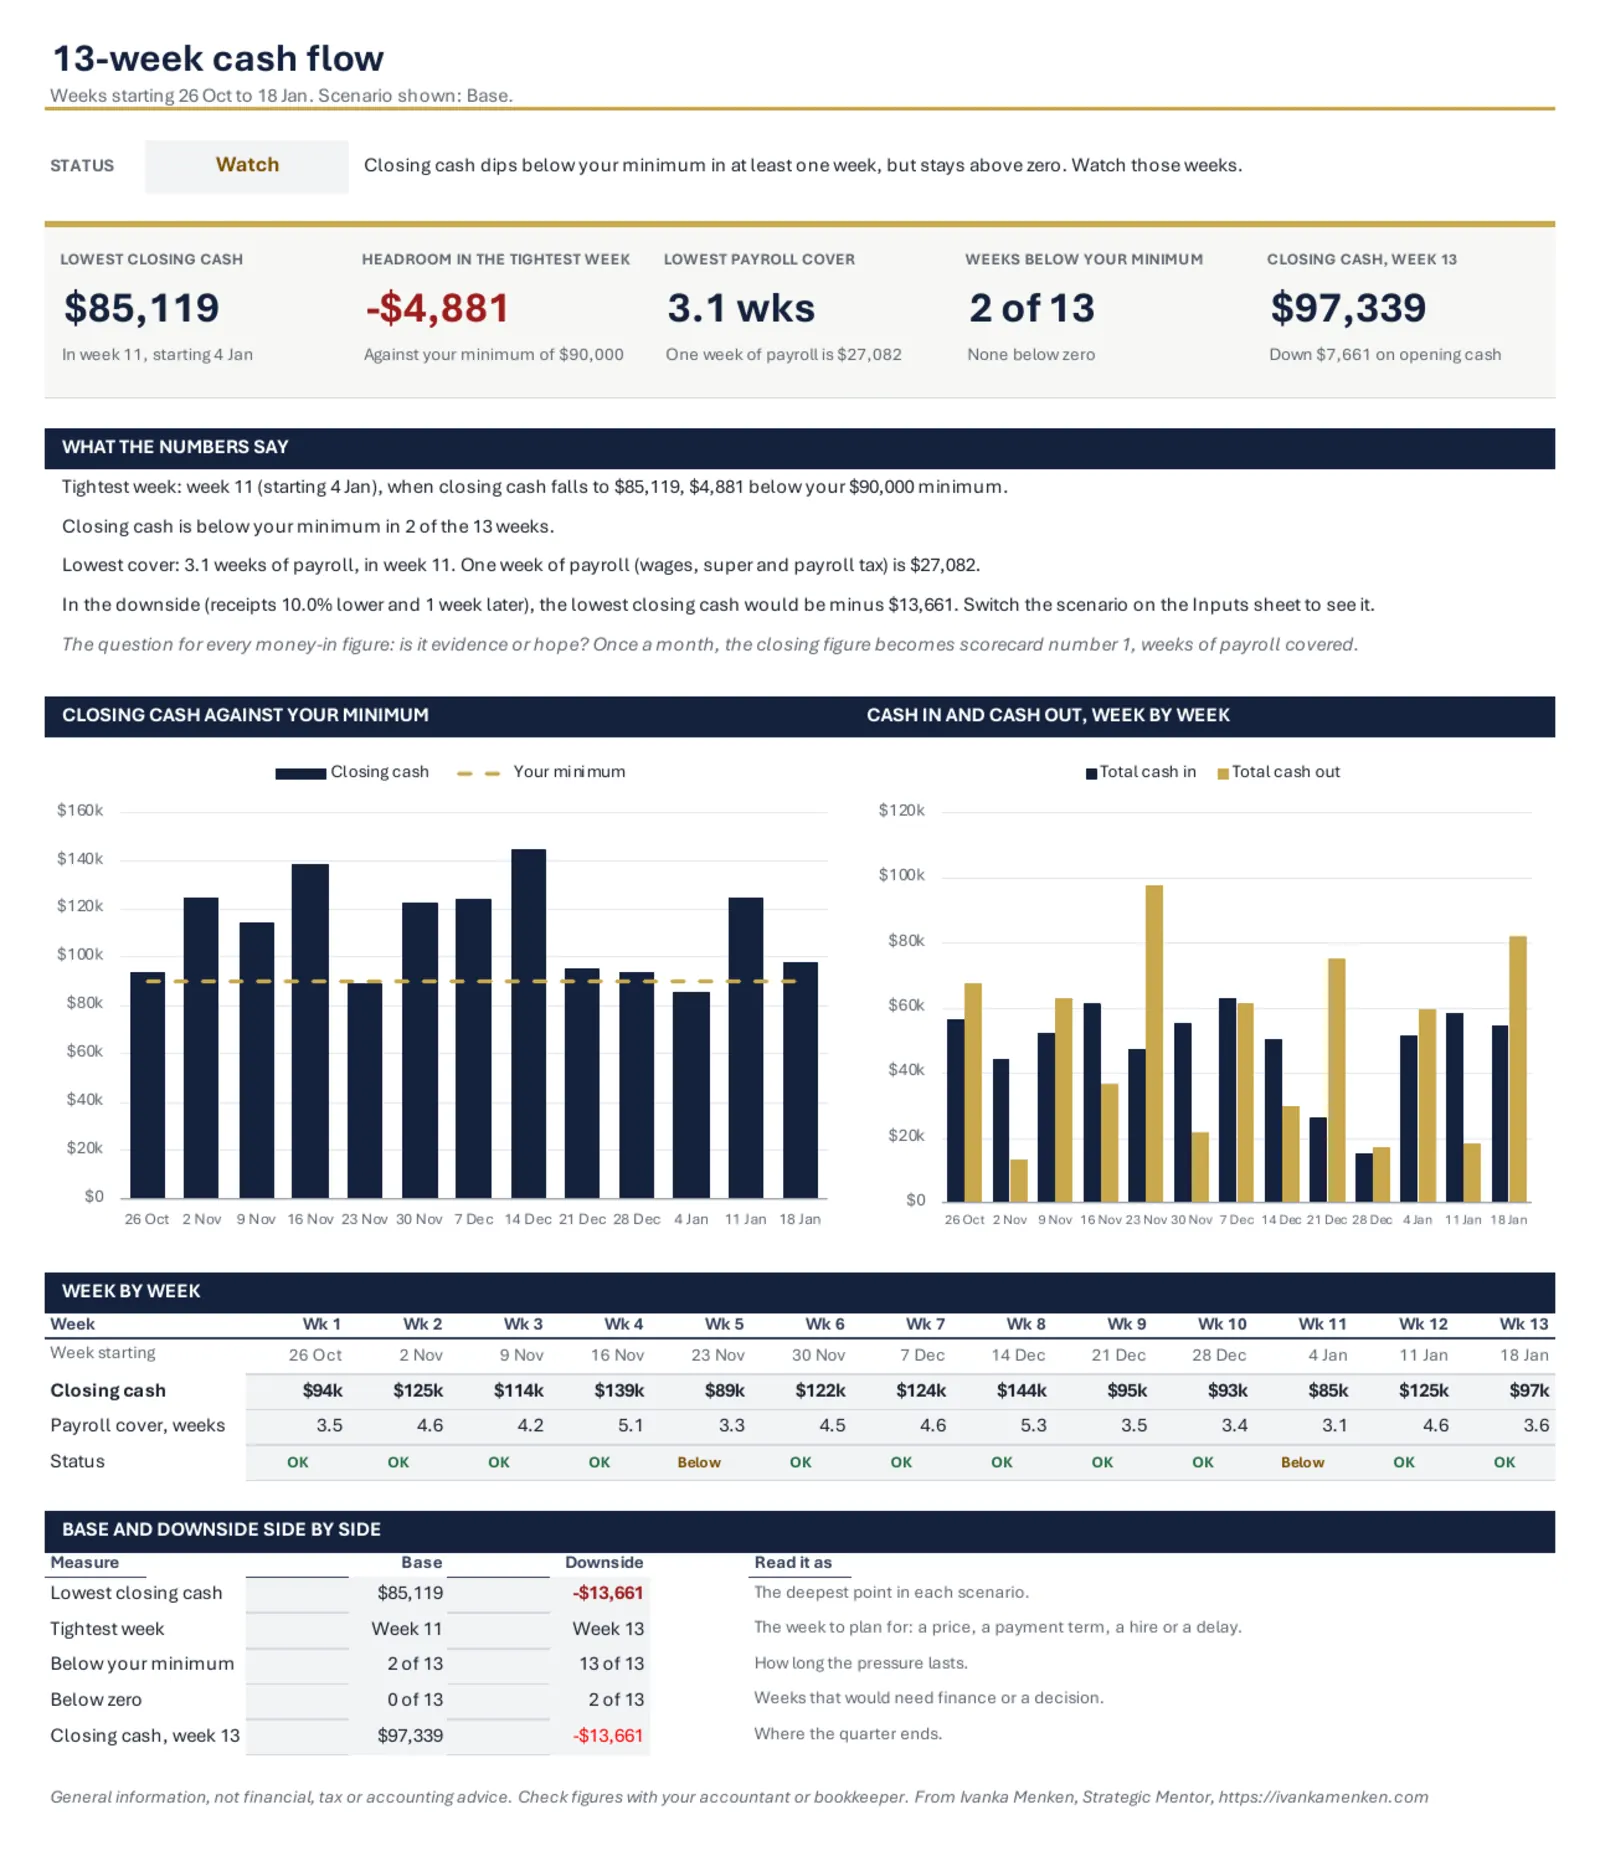
- Dashboard: five KPI tiles, a green, amber or red status against your minimum, plain-English readings built by formula, a chart of closing cash against your minimum, a chart of cash in and cash out, a week by week strip and Base against Downside side by side.
- Cash flow: the weekly workings, with net wages, super paid with wages and payroll tax worked out from your payroll settings, then closing cash and weeks of payroll covered for every week.
- A Downside scenario you set yourself: customer receipts lower by a percentage and later by a number of weeks, switched on with a dropdown.
- Checks: seventeen pass or fix checks, from missing payroll to negative amounts and a reconciliation of the thirteen weeks, rolled up to the cover.
| Week | Cash at the start | Cash in | Cash out, payroll included | Cash at the end | Weeks of payroll covered |
|---|---|---|---|---|---|
| 1 | $105,000 | $56,000 | $67,000 | $94,000 | 3.5 |
| 2 | $94,000 | $44,000 | $13,374 | $124,626 | 4.6 |
| 5 | $138,846 | $47,000 | $97,200 | $88,646 | 3.3 |
| 9 | $144,073 | $26,000 | $75,080 | $94,993 | 3.5 |
| 11 | $93,193 | $51,000 | $59,074 | $85,119 | 3.1 |
Week 1
- Cash at the start
- $105,000
- Cash in
- $56,000
- Cash out, payroll included
- $67,000
- Cash at the end
- $94,000
- Weeks of payroll covered
- 3.5
Week 2
- Cash at the start
- $94,000
- Cash in
- $44,000
- Cash out, payroll included
- $13,374
- Cash at the end
- $124,626
- Weeks of payroll covered
- 4.6
Week 5
- Cash at the start
- $138,846
- Cash in
- $47,000
- Cash out, payroll included
- $97,200
- Cash at the end
- $88,646
- Weeks of payroll covered
- 3.3
Week 9
- Cash at the start
- $144,073
- Cash in
- $26,000
- Cash out, payroll included
- $75,080
- Cash at the end
- $94,993
- Weeks of payroll covered
- 3.5
Week 11
- Cash at the start
- $93,193
- Cash in
- $51,000
- Cash out, payroll included
- $59,074
- Cash at the end
- $85,119
- Weeks of payroll covered
- 3.1
HOW TO USE IT
How do you use the 13-week cash flow template?
- 1Clear the example figuresThe Cover lists the ranges to select and delete, or type straight over the gold cells. Every input has a note on what to enter and rejects entries that make no sense.
- 2Set opening cash and payrollOn the Inputs sheet, set the Monday week 1 starts, cash in the bank, your minimum cash, gross wages per pay run, pay frequency, next pay day and your payroll tax rate. Wages, super and payroll tax then fill themselves in.
- 3Fill in thirteen weeks by typeCustomer receipts go in the week you expect the money, not the week you invoice. Then other income, finance in, and payments: PAYG withholding, suppliers, rent, loans, GST and BAS, and other payments.
- 4Check, then read the dashboardEvery row on the Checks sheet should read Pass. The dashboard then shows the tightest week, how far it sits from your minimum and the lowest weeks of payroll covered, in numbers and in words.
- 5Stress test it and roll it forwardSwitch the scenario to Downside to see receipts lower and later. Once a week, put last week's actual numbers in and add one more week at the far end.
WHAT IT MEANS
What does the result mean for cash and payroll?
Thirteen weeks is a quarter: long enough to see a cash gap coming, short enough to fill in honestly week by week. Further out, the numbers turn into guesses.
The dashboard turns closing cash into weeks of payroll covered, the first number on Ivanka Menken's monthly scorecard, and marks every week that dips below the minimum you set. You can see which week looks tight before it arrives and choose one action for it: a price, a payment term, a hire or a delay.
Super guarantee is 12%, and super timing rules have changed: Payday Super applies from 1 July 2026, so the template pays super in the same week as wages. Check the current rules with your accountant. It is not accounting or financial advice; the question Ivanka asks about every money-in figure is whether it is evidence or hope.
FREQUENTLY ASKED
What do founders ask about this template?
Does the 13-week cash flow template work in Google Sheets and Numbers?
Yes. It is a standard Excel file built with ordinary formulas such as SUM, IF, INDEX and COUNTIF, with no macros, add-ins or links to other files. Upload it to Google Drive and open it with Google Sheets, or open it in Numbers on a Mac. The formulas, dropdowns and status colours carry across, though chart styling can look a little different outside Excel.
Why does it count weeks of payroll rather than months of expenses?
Because payroll is the bill that cannot slip. Ivanka Menken's clients track weeks of payroll covered by cash as the first of five monthly numbers, because it turns a vague worry about money into a figure you can watch. Dividing closing cash by one week of payroll, including super and payroll tax, gives a number you can compare week to week.
What does the downside scenario do?
It tests the plan against customers paying less and paying later. You choose two numbers: how much lower customer receipts are, as a percentage, and how many weeks later they arrive. Switch the scenario dropdown to Downside and every sheet follows. The dashboard always shows the lowest closing cash in both cases side by side, so you can see how much room the plan has.
How does the template handle super and PAYG withholding?
From gross wages per pay run it pays net wages on each pay day and super in the same week, because Payday Super applies from 1 July 2026. PAYG withholding is held back from wages and paid to the ATO later, so you enter those payments in the weeks they leave the bank. Payroll tax is paid monthly at your own effective rate. Check the current rules with your accountant.
Is the 13-week cash flow template financial advice?
No. It is a forward look at cash, filled in by you, built on the 13-week cash view Ivanka Menken uses with founders. Your accountant does the accounts and gives any financial or tax advice, including on super and payroll tax. The template shows which week will be tightest and by how much; what you do about it is your decision.
Download the 13-week cash flow template
Download the spreadsheetFree · No email required
The other templates
If one number keeps you up at night, Ivanka reads it with founders inside her 1:1 mentoring.