FREE SPREADSHEET TEMPLATE
How many clients could you lose after a price increase before gross profit falls?
Enter your current price, your unit cost or gross margin, your volume and a proposed price change. The calculator shows the volume you need to keep the same gross profit, how much you could lose before profit falls and what a discount would demand, with a sensitivity table. It is the arithmetic behind Ivanka Menken's margin-first scaling test.
By Ivanka Menken, Strategic Mentor·Updated
WHAT IS INSIDE
What is in the spreadsheet?
Six sheets, no macros, with the standard break-even volume formula written out. It opens in Excel, Google Sheets and Numbers.
- Cover: how to use it in five steps, a sheet map with links, a colour legend, the example figures to clear, and a status line that reads Ready only when every check passes.
- Inputs: current price, a dropdown for unit cost or gross margin %, volume, the proposed price change, a discount to compare, your own estimate of volume lost and a target gross margin.
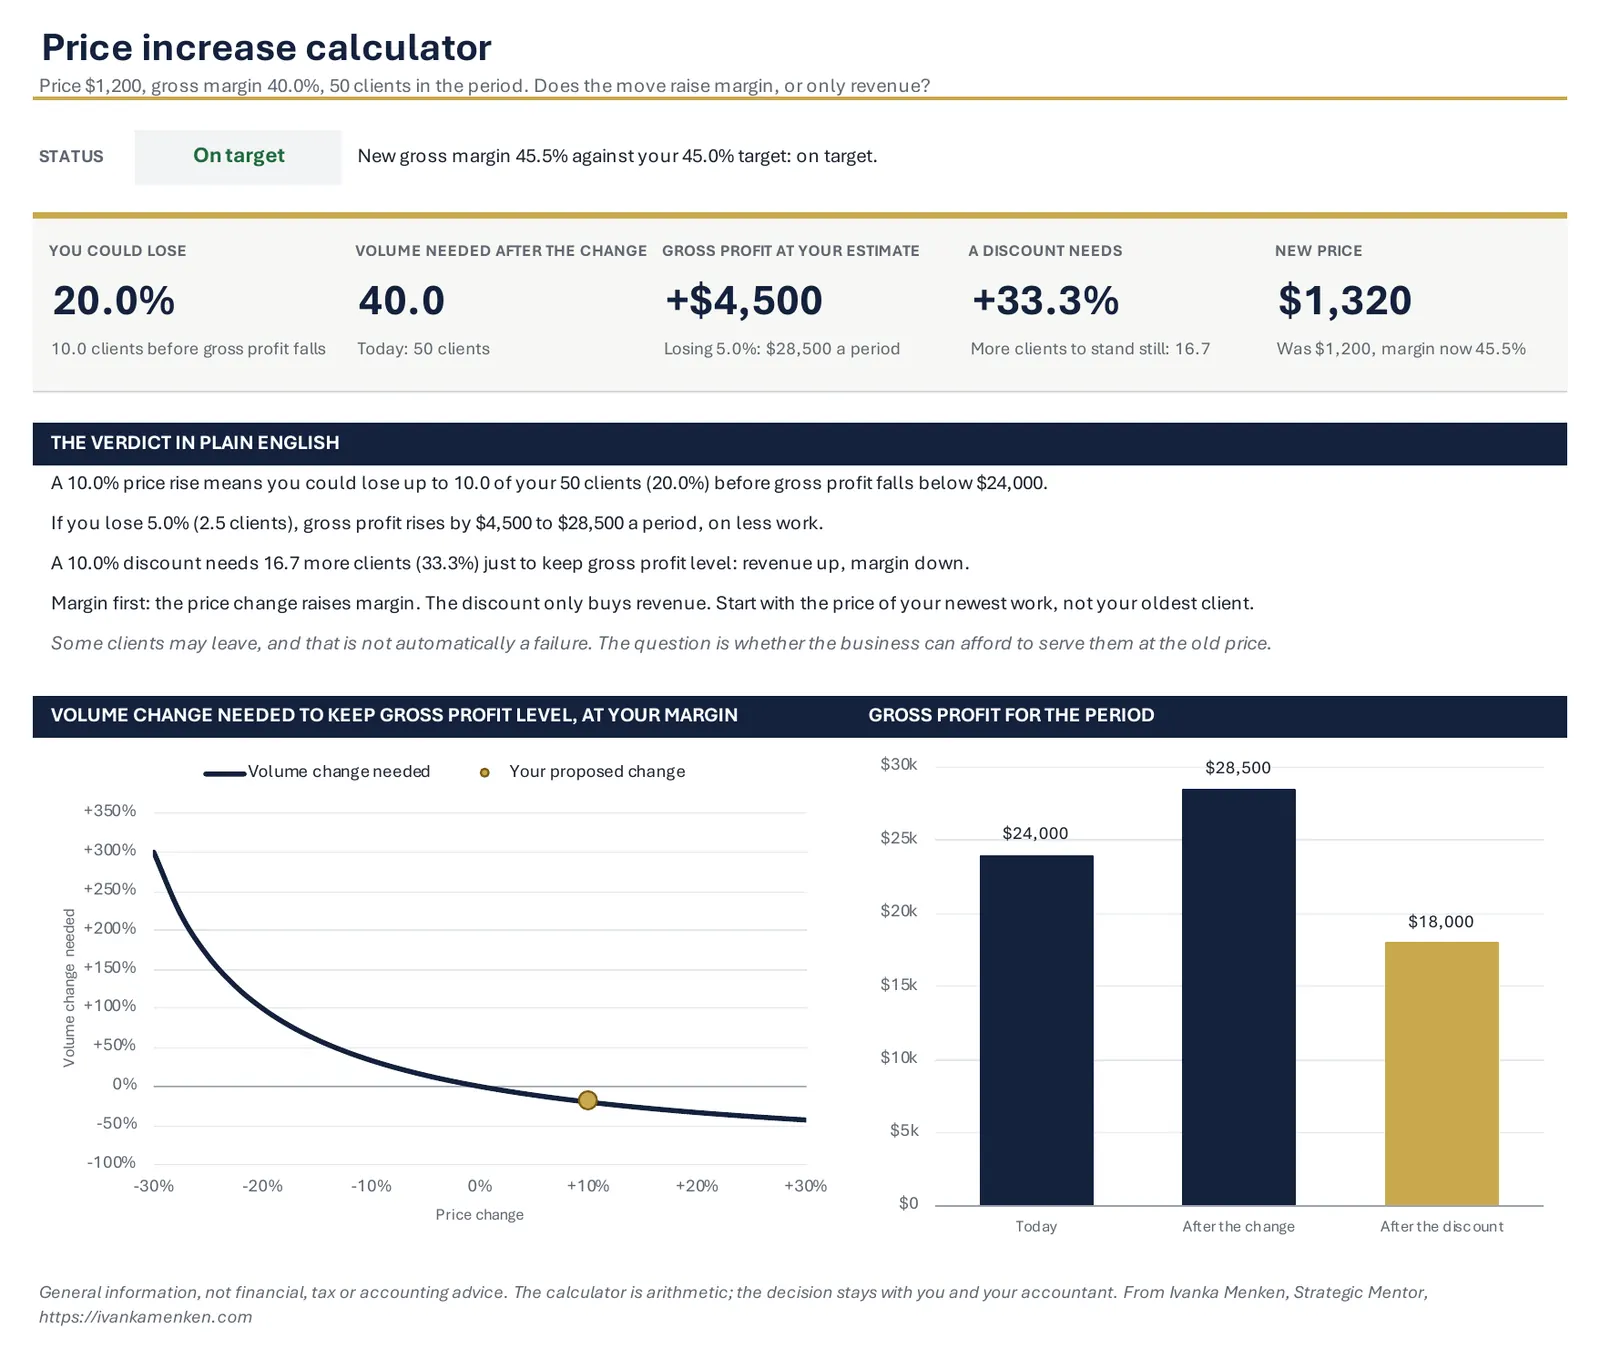
- Dashboard: what you could lose, the volume needed, gross profit at your loss estimate, what a discount needs and the new price, a status against your target margin, a plain-English verdict, the volume change curve at your margin with your move marked, and a gross profit comparison.
- Sensitivity: a two-way table of price changes from a 30% cut to a 30% rise across gross margins from 20% to 70%, showing the volume change that keeps gross profit level, colour scaled, with your margin row marked.
- Calculations: today, after the change, at your loss estimate and after a discount, line by line. Checks: fourteen pass or fix checks, including a margin over 100% and a discount bigger than the margin, rolled up to the cover.
| Line | 10% rise | 10% discount |
|---|---|---|
| New price | $1,320 | $1,080 |
| Margin per unit | $600 | $360 |
| Volume needed to keep the same gross profit | 40.0 | 66.7 |
| Change in clients before gross profit falls | could lose 10 | would need 16.7 more |
| As a share of current volume | 20% | 33% |
| Revenue at that volume | $52,800 | $72,000 |
Line New price
- 10% rise
- $1,320
- 10% discount
- $1,080
Line Margin per unit
- 10% rise
- $600
- 10% discount
- $360
Line Volume needed to keep the same gross profit
- 10% rise
- 40.0
- 10% discount
- 66.7
Line Change in clients before gross profit falls
- 10% rise
- could lose 10
- 10% discount
- would need 16.7 more
Line As a share of current volume
- 10% rise
- 20%
- 10% discount
- 33%
Line Revenue at that volume
- 10% rise
- $52,800
- 10% discount
- $72,000
HOW TO USE IT
How do you use the price increase calculator?
- 1Enter your current pricePrice per unit in the gold cell. A unit can be an hour, a job, a product or a client per month; use the one you quote in.
- 2Pick unit cost or marginChoose Unit cost if you know the variable cost of one unit, or Gross margin % if that is what you know, then fill in that one. An honest estimate is enough to start.
- 3Enter volume and the movesUnits or clients in the period, the price change you are weighing, a discount to compare, your own estimate of volume lost after the rise and the gross margin you are aiming for.
- 4Read the verdictBreak-even volume is your current gross profit divided by the new margin per unit. The dashboard says in plain English how much you could lose, what your estimate does to gross profit and what the discount would need.
- 5Read across your margin rowOn the Sensitivity sheet, follow your margin row from a 30% cut to a 30% rise. Then ask the margin-first question of every move: does this raise margin, or only revenue?
WHAT IT MEANS
What does the result mean for cash and payroll?
Thin prices leave thin margins, growth on thin margins uses cash faster than it brings it in, and payroll becomes a monthly worry. The chain starts with what you charge, so that is where the work starts too. The calculator shows how much room a price rise gives you.
Some clients may leave after a price increase, and that is not automatically a failure. The question is whether the business can afford to serve them at the old price. If you could lose a fifth of your volume and keep the same gross profit, a few leaving changes little, and the ones who stay are the ones your business can afford to serve.
Ivanka Menken's advice is to start with the price of your newest work, not your oldest client, and to track the result on the monthly scorecard: newest-work price against a year ago, gross margin, and weeks of payroll covered by cash. The calculator is arithmetic; the decision, and any financial advice, stay with you and your accountant.
FREQUENTLY ASKED
What do founders ask about this template?
How does the price increase calculator work out the clients you could lose?
It uses the standard break-even volume formula. Current gross profit is volume multiplied by the margin per unit. After a rise, each unit earns a bigger margin, so you need fewer units for the same gross profit: new volume needed equals current gross profit divided by the new margin per unit. The difference between that and your current volume is what you could lose before gross profit falls.
What if I only know my gross margin percentage, not the cost per unit?
Pick Gross margin % in the dropdown and enter your margin. The spreadsheet works out the cost per unit as price multiplied by one minus the margin, and everything else follows. Ivanka Menken's view is that a rough margin you watch every month is more useful than an exact one you never look at, so an honest estimate is enough to start.
Why does a discount need so much more volume than a price rise frees up?
Because a discount comes straight off the margin, not off the price. If your margin is 40% and you discount by 10%, a quarter of the margin on every unit is gone, so you need a third more volume just to stand still. That is why Ivanka Menken ranks growth moves by what they do to margin, not revenue: volume bought with a thinner margin usually sinks.
Does the calculator tell me how much to raise my prices by?
No. Ivanka Menken does not give a percentage, because the right number depends on your margin, your market and the work itself. The calculator shows what each rise or discount does to the volume you need, so the conversation starts from arithmetic rather than fear. The decision is yours, and your accountant advises on anything financial or tax related.
What does the sensitivity table show?
For each pair of gross margin and price change, it shows the volume change that keeps gross profit level. Read across your margin row: green cells are volume you could lose after a rise, red cells are extra volume a cut needs, and grey cells mark a cut bigger than the margin, where every sale would lose money.
Download the price increase calculator
Download the spreadsheetFree · No email required
The other templates
If one number keeps you up at night, Ivanka reads it with founders inside her 1:1 mentoring.